Library Spectrograms
A library spectrogram is a form of visualisation that describes a library collection by visualising the relative number of books or other items under each Dewey subject heading. Each Dewey class is represented within the spectrogram by a different colour. Different shades of each colour represent the divisions within each class.
These visualisations are inspired by the output of spectroscopes (devices that display the light from stars and galaxies as a spectrum of component colours).
Library spectrograms can also be used as interactive interfaces to explore library collections. An interactive library spectrogram is now integrated as an interactive tool for browsing within UTS Library’s catalogue search. The spectrum makes understanding and browsing the Library’s collections more intuitive and engaging.
Related works:

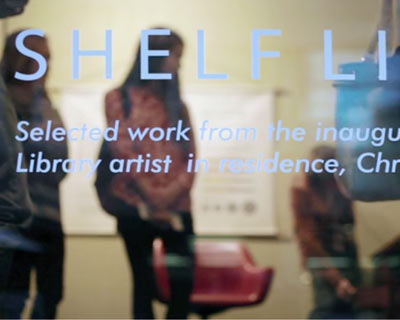
Shelf Life
Featured works from a residency at UTS Library that re-imagine library interfaces to encourage serendipity and discovery.

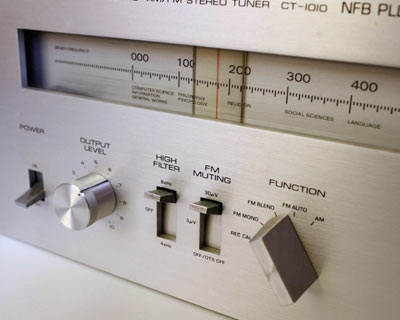
Library Frequency Tuner
A device for ‘tuning-in’ to the books in a library.

Call Number Telephone
A telephone for dialling library books.

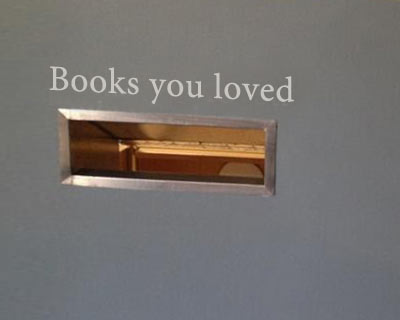
Return Chutes
Library return chutes that prompt more thought-provoking returns.

